Your orchard soil has lost roughly half the carbon it started with. That loss is why your input bill keeps climbing — and it is also an empty account you can refill and sell. Here is what the credits are really worth, and what has to be true in your soil first.
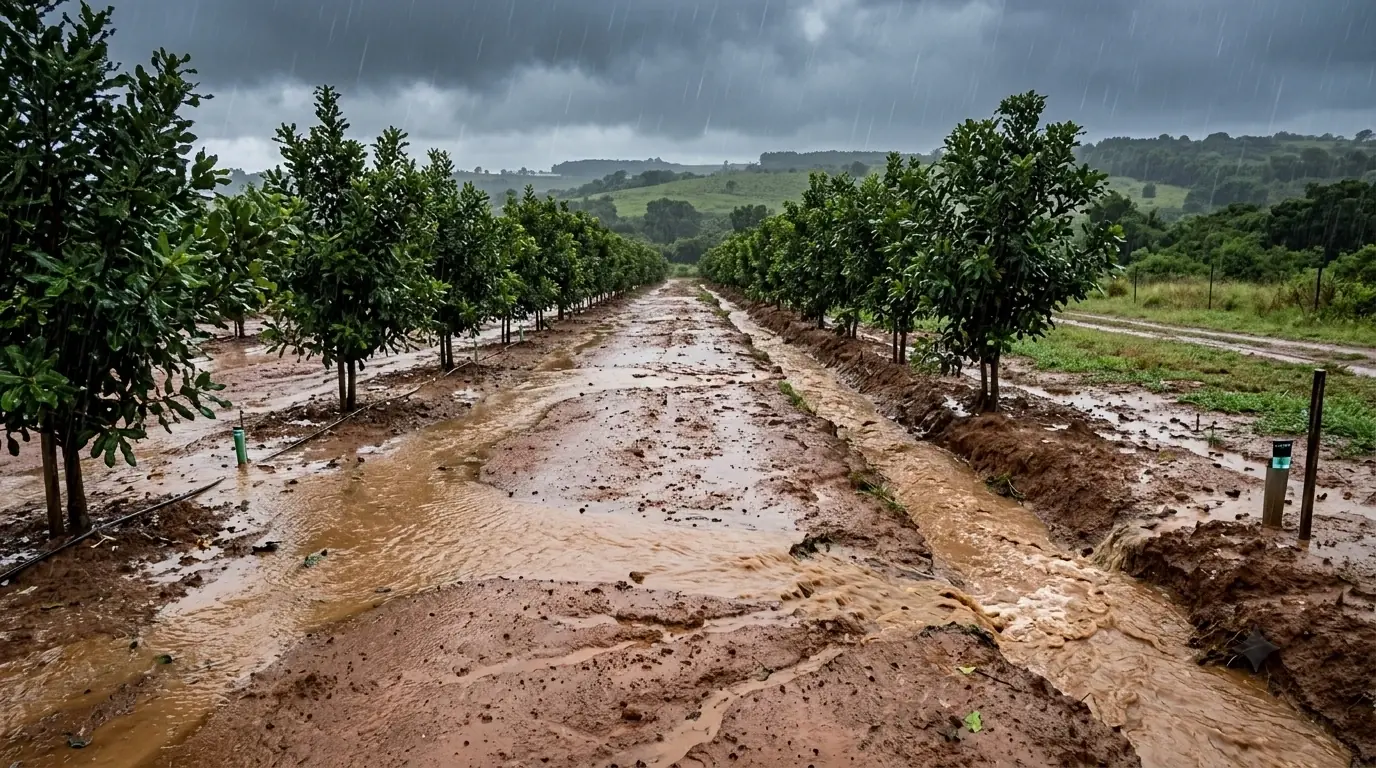
Walk into a conventional macadamia block in the middle of a dry August. The inter-row is bare, sprayed out, and hard. When the first rain comes it will not go in. It will run across the surface, take your topsoil with it, and end up in the drain. That is not just erosion. That is your carbon leaving the farm.
Continual cultivation cuts South African topsoil carbon by around 45% on average, with losses running from 30% to 75% depending on the site.1 In the sub-humid regions — macadamia and avocado country — the average loss measured across southern Africa is about 53%.2 Roughly 58% of South African soils now carry less than 0.5% organic carbon.1
Most growers read that as damage. It is also an opening. A depleted soil has room to gain carbon that a healthy one does not, and measurable gain is a saleable asset.
So: what is a credit actually worth on an orchard? What has to happen in your soil before one gets issued? And — the question nobody here seems willing to answer — is the money any good?
What this article answers
About R135–R165 a credit — and an orchard generates very few of them per hectare. See the arithmetic →
Through biology, not by tipping organic matter on the ground. Microbes and fungi build the stable pool a registry will pay for. See how →
Because on the same block, one is worth roughly twenty to a hundred times the other. The credit is the smallest of three returns. See the comparison →
Two to three years — which is a problem, because the risk arrives long before the money does. See the timeline →
Verra's VM0042 measures a baseline and models the gain. You are paid for the change, not the carbon you already had. See the method →
Yes. A Koue Bokkeveld orchard matched conventional yields with no drop in fruit quality. Transitions fail on sequencing, not agronomy. See the J-curve →
By measuring the biology — before a developer ever sets a baseline for you. See the sequence →
Two things are converging.
The first is regulation. Phase 2 of the carbon tax began on 1 January 2026 and runs to the end of 2030. The headline rate jumped from R236 to R308 per tonne of CO2e — the biggest increase since the tax began — and is legislated to reach R462 by 2030.3 Treasury also raised the carbon offset allowance, which lets emitters cut their tax bill by buying credits.3 Higher tax, more room to offset: that is a demand curve being built by law.
And agriculture sits outside the carbon tax net.4 You do not pay it. You are on the supply side of it. Every rand the tax climbs makes the credit you could sell worth more.
The second is market access. Retailers are pushing carbon accounting down their supply chains, and export programmes already footprint South African fruit. Carbon performance is starting to gate who gets to sell, not just who gets paid.5
Credits are paid for change, not for condition. The grower whose soil is furthest gone has the most headroom to gain — and therefore the most to sell. The grower who has already quietly built good soil, and never measured it, has given that value away.
Skip this and the rest will not make sense. Credits are paid on stable carbon, and stable carbon is built by biology, not by tipping organic matter on the ground.
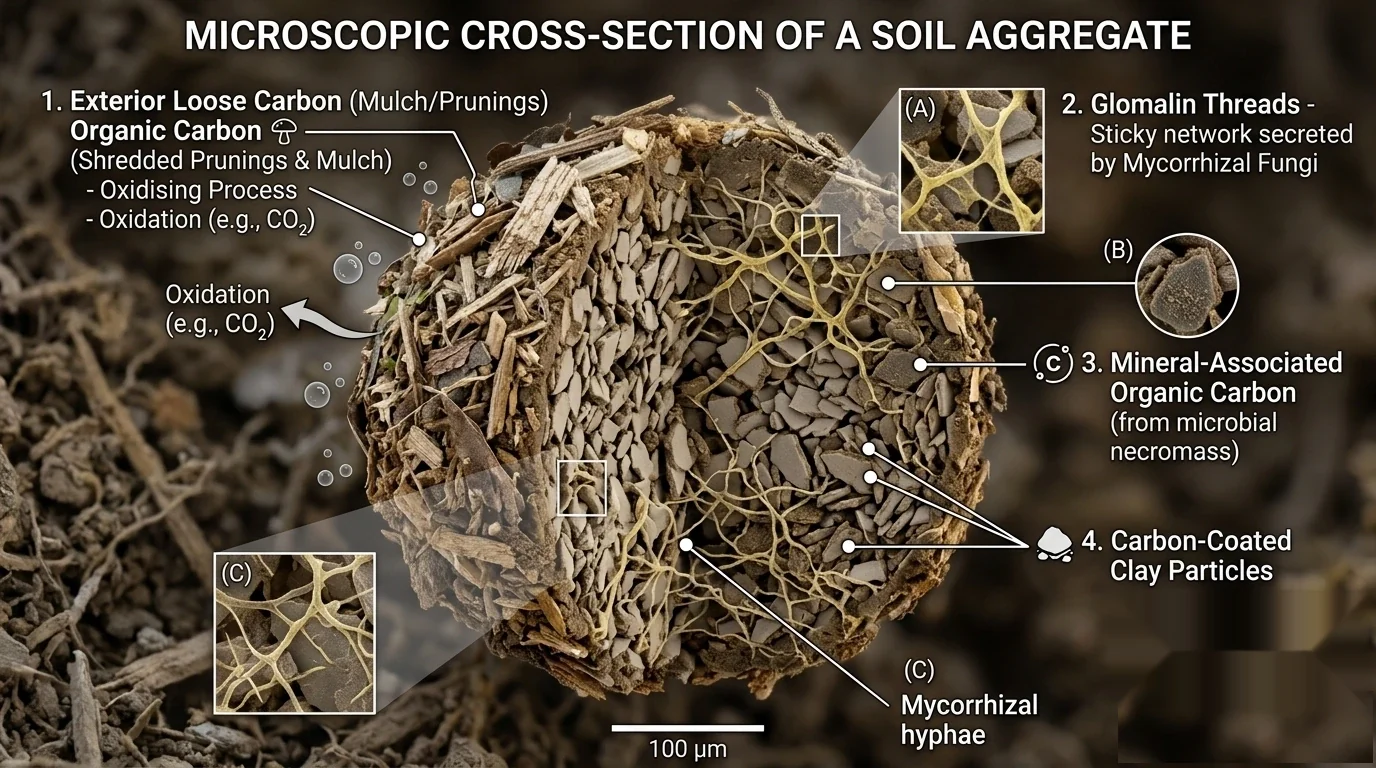
Particulate organic carbon (POC) is the fast pool — prunings, dead roots, mulch not yet broken down. It feeds microbes and improves structure, but it oxidises straight back to CO2 the moment you disturb the soil. A fuel tank, not a bank account.
Mineral-associated organic carbon (MAOC) is the slow pool. It forms when microbial bodies die — necromass — and the residue bonds onto clay and silt particles. Once bound it can sit there for centuries. That is the carbon a registry pays for.
The route from POC to MAOC runs through living organisms. Mulch alone will not get you there. Microbes will.
Arbuscular mycorrhizal fungi colonise the roots of most plants, macadamia and citrus included. The tree feeds them liquid carbon as root exudate; in return they deliver water, phosphorus and zinc from soil the roots cannot reach. Those fungal threads secrete glomalin, a sticky, carbon-rich glycoprotein that glues soil particles into water-stable aggregates. Carbon locked inside an aggregate is shielded from the microbes that would otherwise respire it away. Fungi do not just store carbon — they build the vault it sits in.
Now the detail that costs growers most, and almost nobody mentions. When soluble phosphorus is freely available, the tree stops signalling to the mycorrhizal fungi. Why pay for a delivery service when the goods are already at the door? Colonisation drops. Glomalin production stops. Aggregates break down. The carbon inside them oxidises.
So the fertiliser dismantles the system that would have let you stop buying fertiliser. You are paying twice, in opposite directions.
Tilled, sprayed, synthetically fed soils go bacterial — an F:B ratio around 0.1 to 0.3. Bacteria respire away more of what they eat. Fungi carry the enzymes for lignin and cellulose, and hold onto more of the carbon they consume. Macadamias are a climax forest species. They want a fungal soil, 2:1 to 5:1.
None of this is exotic. The practices are ordinary and most of the material is already on your farm.
Cover crops turn the inter-row from a liability into a carbon pump. In a Eureka lemon trial at Franschhoek, one year of vetch, medics and oats lifted soil pH from 5.42 to 6.00 — but soil enzyme activity did not shift significantly in the same period.6 Take that honestly. Chemistry can move in a season. Biology takes longer. Anyone promising a rebuilt soil food web in twelve months is selling something.
Macadamia husk compost is waste the industry already produces. In an orchard-floor trial, microbial biomass carbon in the top 2 cm under husk compost reached more than 300% of the bare-soil control after 18 months; municipal green-waste compost managed about 50%. Soil pH rose from 4.15 to 5.0.7 Work at the ARC's Levubu site found husk compost at 15 and 30 t/ha lowered bulk density and raised water-holding capacity, pH, organic carbon, N, P, K, Ca, Mg and Zn in a sandy loam.8
| Practice | Mechanism | Documented impact |
|---|---|---|
| Leguminous cover crops (vetch, medics, clovers) |
Biological nitrogen fixation via Rhizobium; low C:N residue cycles fast | Clovers fixing up to 50 kg N/ha/year in converted pome-fruit blocks; soil pH lifted 5.42 → 6.00 in one season under citrus |
| Gramineous cover crops (oats, rye, triticale) |
High biomass; deep fibrous roots open channels | Relieves compaction; suppresses weeds; cuts evaporation from the orchard floor |
| Macadamia husk compost | Pre-digested stable carbon; fungal substrate | Microbial biomass carbon >300% of bare soil at 18 months; lower bulk density; higher pH, organic carbon, K, Mg, Zn |
| Livestock integration | Trampling; concentrated manure and urine; grazing replaces mowing | Winter sheep grazing converts weeds to fertiliser and reseeds clovers; chickens control weevils nearly as well as sprays |
The first and most reliable return is not the credit. It is the invoice you stop paying.
Restored fungal networks deliver phosphorus and zinc the tree used to buy. Legumes fix nitrogen out of the air. Synthetic nitrogen is leaky by nature — it leaches past the root zone as nitrate and volatilises as nitrous oxide. A meaningful share of every bag never reaches the tree.
Then water. Carbon is a sponge. At Howbill in the Koue Bokkeveld, ten years of data shared with the local water users association show irrigation falling from 9,500 m³/ha to 7,000–7,500 m³/ha — about 25% less — while yields rose.5 Electricity, pumping hours and water tariff, all down.
But hold the caution: input reduction only protects your margin if the yield holds. Cut inputs before the biology can carry the load and you have not saved money. You have bought a yield collapse at a discount.
One carbon credit is one verified tonne of CO2e removed or avoided. One tonne, one credit. Now let us do the multiplication in public, because nobody else in this market seems willing to.
AgriCarbon — run by Anthesis, and the first programme in Africa to issue credits under Verra's VM0042 methodology — tells farmers its programme has shown potential of 1 to 2 tonnes of credits per hectare per year, based on submitted farm data.9
Now check that against what was actually issued. The project registered 39,207 verified carbon units across 17,582 hectares farmed by 29 growers.10 Divide one by the other: about 2.2 credits per hectare in total across the whole first crediting period — not per year. Well below the headline potential, and that is on cropland and grazing land, which cycles carbon faster than a perennial orchard floor.
Modelled orchard projects sit lower still, near 0.3 tonnes per hectare per year. Read the table as modelled and benchmark figures, before deductions — not as a promise about your farm.
| Intervention | Est. sequestration (tCO2e/ha/yr) | = Credits/ha/yr | Gross value at R135–R165/credit |
|---|---|---|---|
| Orchard soil carbon project (modelled baseline) | ~0.30 | 0.30 | R40–R50 |
| Improved soil management | ~0.35 | 0.35 | R47–R58 |
| Improved nutrient management | ~0.33 | 0.33 | R45–R55 |
| Optimised water management (cross-sector benchmark, not an orchard result) | up to 1.14 | 1.14 | R154–R188 |
These stack. They are not alternatives. And note which lever is biggest: water. Hold that thought.
What does a credit fetch? Two South African price points, both real. The JSE Ventures Voluntary Carbon Market's first trades of carbon-tax-eligible credits went through at $8.25 each.11 AgriCarbon tells its farmers to expect from US$10 per verified credit.9 At about R16.30 to the dollar, that is roughly R135 to R165 a credit.
So: at 0.3 credits per hectare, gross credit income is around R40 to R50 per hectare a year. Stack water and nutrient management towards 1 to 2 credits per hectare and you reach roughly R135 to R330 per hectare a year.
That is between R8,000 and R66,000 a year, gross — before developer fees and before the buffer deduction. Now set it against this: at De Keur, the regenerative block saved R7,800 per hectare on chemicals alone.5 Across 200 hectares, about R1.56 million. The input saving is not slightly bigger than the credit cheque. It is one to two orders of magnitude bigger.
You will see a figure of R180 to R2,100 per hectare quoted around this market. Do the sums. To earn R2,100 at R165 a credit you would need nearly 13 tonnes of CO2e per hectare per year — more than forty times the modelled orchard rate. That range spans every project type, afforestation included. Orchards sit at the very bottom of it.
The credit cheque is the smallest of the three returns. It is not what makes the transition pay. What it does is make the transition auditable.
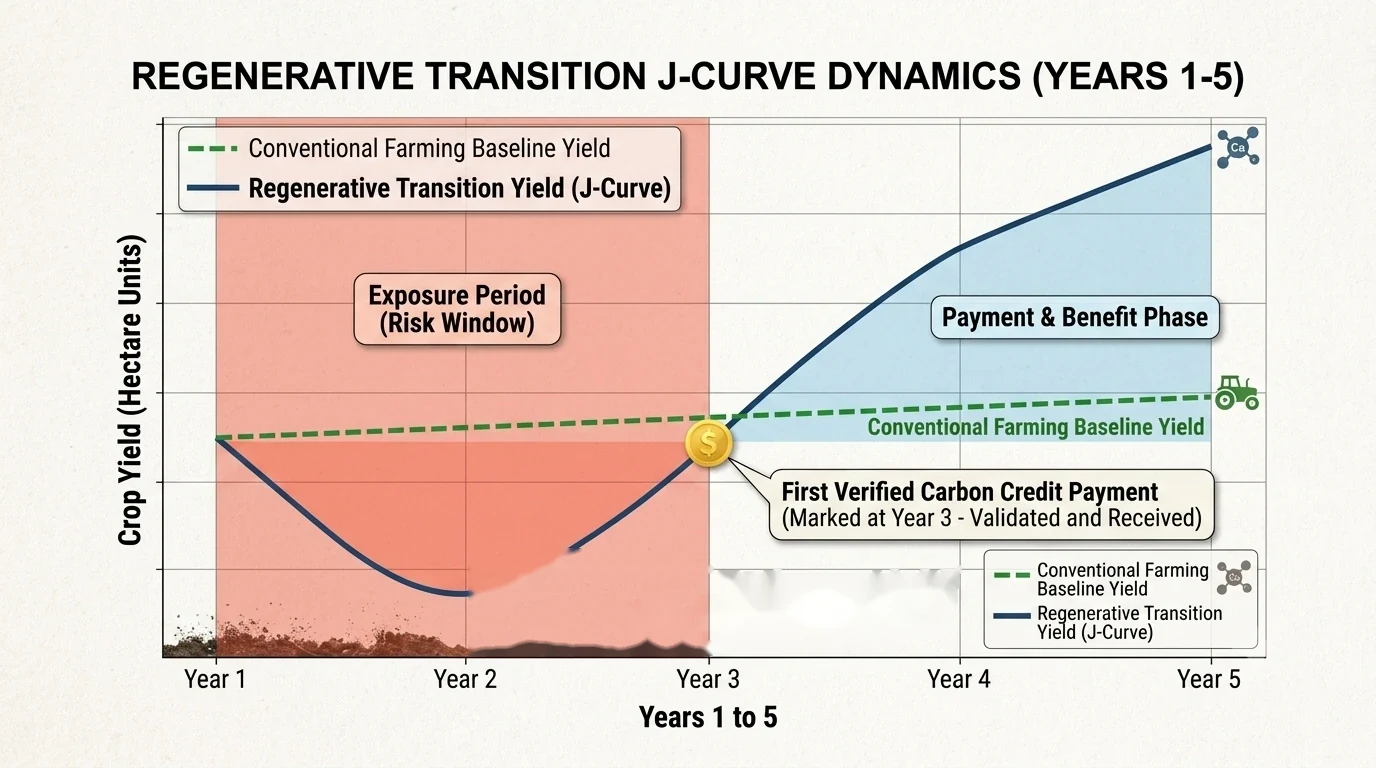
Baselining, verification and permanence proof take time. Expect two to three years between onboarding and your first verified credits. After that you are paid annually. AgriCarbon adds a 5% loyalty bonus for submitting data across a full five-year cycle — leave early and you forfeit the bonus and your remaining buffer credits.9
Read that cash flow carefully, because it decides everything that follows. The input cuts, the biological risk and the yield exposure all land in years one to three. The first payment lands in year three at the earliest. Over five years you realistically bank two or three payment years, not five.
Carbon credits cannot fund your transition. They arrive after the hard part is over. The risk window and the payment window do not overlap. Years one to three must be carried by input savings and protected yield — or not at all.
Verification is expensive. Registration and audit fees have historically run to tens of thousands of dollars per project — precisely why South Africa's domestic registry, Credible Carbon, was built to cut them.12 Even so, it requires a minimum project scale of 1,000 tonnes of CO2 a year.13 At 0.3 tonnes per hectare, a lone orchard would need over 3,000 hectares to clear that bar.
So developers aggregate, pooling farms into one grouped project to spread the cost. You will meet AgriCarbon (Verra VM0042, Africa's first);10 Orizon Agriculture, whose CarbonCrop Rewards programme launched with Standard Bank at Nampo in May 2026 as the first bank-backed regenerative carbon programme in the country;14 Credible Carbon, which returns at least 60% of net revenue to project beneficiaries;12 and the JSE Ventures Voluntary Carbon Market for local price discovery.11
The division of labour is clean. The developer's job is paperwork. Your job is soil. Nobody gets paid if the biology is not there.
Under Verra's VM0042 methodology — the one AgriCarbon uses — developers take a "measure and model" approach. Physical soil samples across depths and climate zones set your Soil Organic Carbon baseline. A biogeochemical model then combines that baseline with your field history and climate data to estimate what your practices achieved.
The credit is a delta, not a stock. You are paid for the difference between your baseline and where you get to. Nobody pays you for the carbon you already have.
This is the part growers miss, and it changes the maths. Issued credits are sequestration plus avoided emissions. The avoided half comes from using less synthetic fertiliser, less tillage, less diesel — AgriCarbon lists reduced fertiliser application and improved irrigation energy efficiency among its qualifying practices.9 So cutting synthetic nitrogen does not only save you the invoice. It mints credits in its own right, through reduced nitrous oxide and reduced embedded manufacturing emissions. One decision, two revenue lines.
From that gross figure the developer subtracts uncertainty, leakage (emissions merely pushed elsewhere) and a buffer reserve held against future reversal. Plough it out and the carbon is gone, and so is the credit — permanence under Verra is typically monitored for 40 to 100 years.15 Issued credits are always fewer than calculated sequestration. Plan on it.
But look closely, because one of those three is under your control. Leakage and the buffer are structural. Uncertainty is a measurement problem. The tighter and longer your data, the smaller the uncertainty deduction, and the more credits get issued. Better measurement is not just good agronomy. It is literally more credits.
And understand what you are signing. You are not selling carbon. You are selling a promise to keep it there.
Go back to the table. Optimised water management carries the largest single mitigation figure — up to 1.14 tonnes per hectare, bigger than soil and nutrient management combined. Frame it correctly: that is a benchmark across agricultural carbon projects generally, not a verified orchard result. Your orchard will not mitigate 1.14 tonnes simply because you irrigated better.
Your water footprint has three parts. Blue water is what you pump from rivers and boreholes. Green water is rainwater held in the soil and used by the tree. Grey water is the freshwater it would take to dilute what you leach — nitrate, mostly — back to acceptable quality. Water becomes carbon through emission factors: less pumping means less electricity and diesel, less leaching means less nitrous oxide. Both are counted.
Now the fear. You pull the synthetics, the biology has not recovered, and yield falls for several seasons before it climbs back. That is the transition J-curve. On 100-plus hectares of export macadamias it is not a learning experience. It is an insolvency event.
And it is not theoretical. De Keur went "cold turkey", eliminating fertiliser entirely in their regenerative blocks. Their own head of regenerative agriculture, Anton de Jager, admits it could have been phased more gradually.5 They had the balance sheet and the technical support to survive it. Most growers do not.
Stack the timing on top. Credits do not pay for two to three years, so you are most exposed in exactly the years when carbon income is zero. Regenerative transitions do not usually fail on bad agronomy. They fail on bad sequencing. The J-curve is not survived with optimism, and certainly not with a carbon contract. It is survived with data.
Standard soil chemistry tells you what minerals are present. It cannot tell you whether the biology exists to make them available. A tree can starve for phosphorus on a soil that tests adequate, because the mycorrhizal network that would have delivered it is dead. You cannot manage a biological transition with a chemistry test.
Our method is a measure → interpret → act → remeasure loop, built for macadamias, avocados and citrus. Three pillars.
1. Biological baselines. A tiered assessment, from a free 9-indicator field score to a 16-indicator lab analysis: microbial biomass, active carbon and CO2 burst, F:B ratio, mycorrhizal colonisation. Point that straight back at VM0042. The developer's model starts from a physical SOC baseline, and the uncertainty deduction shrinks as measurement quality rises. The grower who has measured properly for two years enrols with a defensible baseline and a smaller haircut. The one who has not, does not.
2. Plant SAP analysis. This measures what is dissolved in the tree's vascular fluid right now, old growth against new. It catches an uptake deficit weeks before you would see a symptom, and months before it costs you a crop. This is the safety net that makes input reduction survivable.
3. Gateway logic. Inputs are withheld when the soil cannot use them — compaction, aluminium toxicity, dead biology. Hard stops on KCl and on ammonium fertilisers like MAP and DAP, which acidify soil and suppress fungi. Where the soil is shut down, the system goes foliar-first: feed the leaf, rebuild the ground underneath it.
Every kilogram of synthetic nitrogen you withdraw safely is an avoided-emission credit, a lower input bill, and less nitrate in your grey water footprint. One decision, three returns — but only if the biology can carry it. Proving it can is what pillars one and two are for.
The point was never to farm without inputs. The point is to remove each input only once the biology has demonstrably replaced its function — and to hold the data that proves it did.
In the Koue Bokkeveld, De Keur ran a direct comparison in the 2022–23 season. Orchard 141, regenerative, against a conventional block. Organic matter went from 2.5% to 3.2%. Soil carbon from 1.5% to 1.9%. Water infiltration from five seconds to one. Fungi, protozoa, nematodes and earthworms came back. Chemical spend fell by R7,800 a hectare.
And this is the sentence that matters most to you:
Do not over-read it. Charl du Toit is blunt that overall costs have not yet dropped, because the upfront investment is heavy — though he expects regenerative to be the cheaper system within ten years.5 This is a long game with a real J-curve in it. It is simply a survivable one, with the right data.
On the credit side, Spier near Stellenbosch is the honest domestic benchmark. Mob grazing across 74 hectares of pasture, audited through Credible Carbon, credited with 6,493 tonnes of CO2. The farm earned R204,000, half of it shared among 27 workers — about R4,000 each.16 Real money, honestly audited, paid to the people who did the work. Also a rounding error next to a commercial orchard's input budget. Both are true.
You cannot enrol in a credit programme off a chemistry test. Every developer's process starts from a baseline — and the baseline you need for your own agronomy is the same one that sets your credit potential. You were going to have to measure this anyway.
The sequence is not complicated. Baseline the biology. Fix the bottleneck first — compaction, pH, aluminium, dead soil. Build carbon with cover crops and the organic matter your farm already produces. Reduce synthetics only as far and as fast as your SAP data permits. Then approach a developer, from a defensible starting point.
Growers who start measuring now will enrol from strength. Growers who wait will spend three years improving a baseline nobody recorded — and get paid for none of it. The carbon they built will simply become the new zero.
Baseline early. That is the whole of the advice.
Roughly R40 to R330 per hectare per year, gross, before developer fees and buffer deductions. On a 200 hectare macadamia block that is about R8,000 to R66,000 a year. The figure depends on how many credits per hectare your soil actually generates — modelled orchard projects sit near 0.3 tonnes of CO2e per hectare per year, and stacking water and nutrient management can push it towards 1 to 2 tonnes.
About R135 to R165. The JSE Ventures Voluntary Carbon Market's first trades of carbon-tax-eligible credits went through at $8.25 each, and AgriCarbon tells its farmers to expect from US$10 per verified credit. At roughly R16.30 to the dollar that gives the range above. South Africa's domestic registry, Credible Carbon, has traded credits between R36 and R140 per tonne.
Two to three years. Baselining, independent verification and permanence proof all take time. After the first issuance you are paid annually. This matters because the yield risk of a regenerative transition lands in years one to three — exactly the years when carbon income is still zero. Carbon credits arrive after the hard part is over. They cannot fund the transition itself.
No. Agriculture, forestry and other land use remains outside the carbon tax net. Growers sit on the supply side of the market, not the paying side. Phase 2 of the tax began on 1 January 2026, lifting the headline rate from R236 to R308 per tonne of CO2e, and it is legislated to reach R462 by 2030. Every rand the tax climbs makes the credit a grower can sell worth more.
Almost never. Verification is expensive, and South Africa's Credible Carbon registry requires a minimum project scale of 1,000 tonnes of CO2 a year. At 0.3 tonnes per hectare, a lone orchard would need over 3,000 hectares to qualify on its own. This is why project developers such as AgriCarbon and Orizon Agriculture aggregate many farms into one grouped project and spread the verification cost.
It can, and that is the transition J-curve. But it is not inevitable. In De Keur's Orchard 141 trial in the Koue Bokkeveld, the regenerative block matched the conventional block on yield with no drop in fruit quality, while saving R7,800 per hectare on chemicals. The failures usually come from bad sequencing rather than bad agronomy — pulling synthetic inputs before the soil biology can carry the load. Removing each input only once measurement proves the biology has replaced its function is what makes the transition survivable.
Under Verra's VM0042 methodology, developers use a "measure and model" approach. Physical soil samples set your Soil Organic Carbon baseline, then a biogeochemical model combines that baseline with your field history and climate data. The credit is a delta, not a stock — you are paid for the gain, not for carbon you already had. Issued credits are always fewer than calculated sequestration, because uncertainty, leakage and a buffer reserve are deducted.
Note on figures: all carbon revenue estimates in this article are indicative and site-dependent. Sequestration rates are modelled, and issued credits are always lower than modelled sequestration once uncertainty, leakage and buffer deductions are applied. This is not financial advice. Succession Soils does not issue, verify or broker carbon credits — registries and project developers do that. We measure and build the soil carbon that makes them possible.
Every developer's process starts from a biological baseline — and so does every sensible nutrition programme. Run the free 9-indicator field score on one block. It takes an afternoon, it costs nothing, and it tells you where you actually stand before you talk to anybody about credits.
Run the Free 9-Indicator Field Score