The Succession Soils Method
Three integrated services that apply biological science to restore living soils and build ecologically resilient, economically secure orchards.
How It Works
From Sample to Action in Four Steps
Field Assessment & Sampling
We take soil and leaf sap samples and conduct infield soil assessments to identify physical limitations to tree development—compaction, drainage, root zone constraints—and set a baseline to measure progress.
Laboratory Analysis
Samples are analysed by accredited laboratories for microbial biomass, fungal-to-bacterial ratios and full sap nutrient profiles.
SAP Analysis Engine
We use our proprietary sap analysis engine to identify hidden hungers and excesses that are limiting the tree’s genetic potential.
Treatment Protocol
The analysis engine uses multi-layered data sets to produce a treatment protocol and practical spray program tailored to your orchard.
Pillar 1
Soil Health Assessments
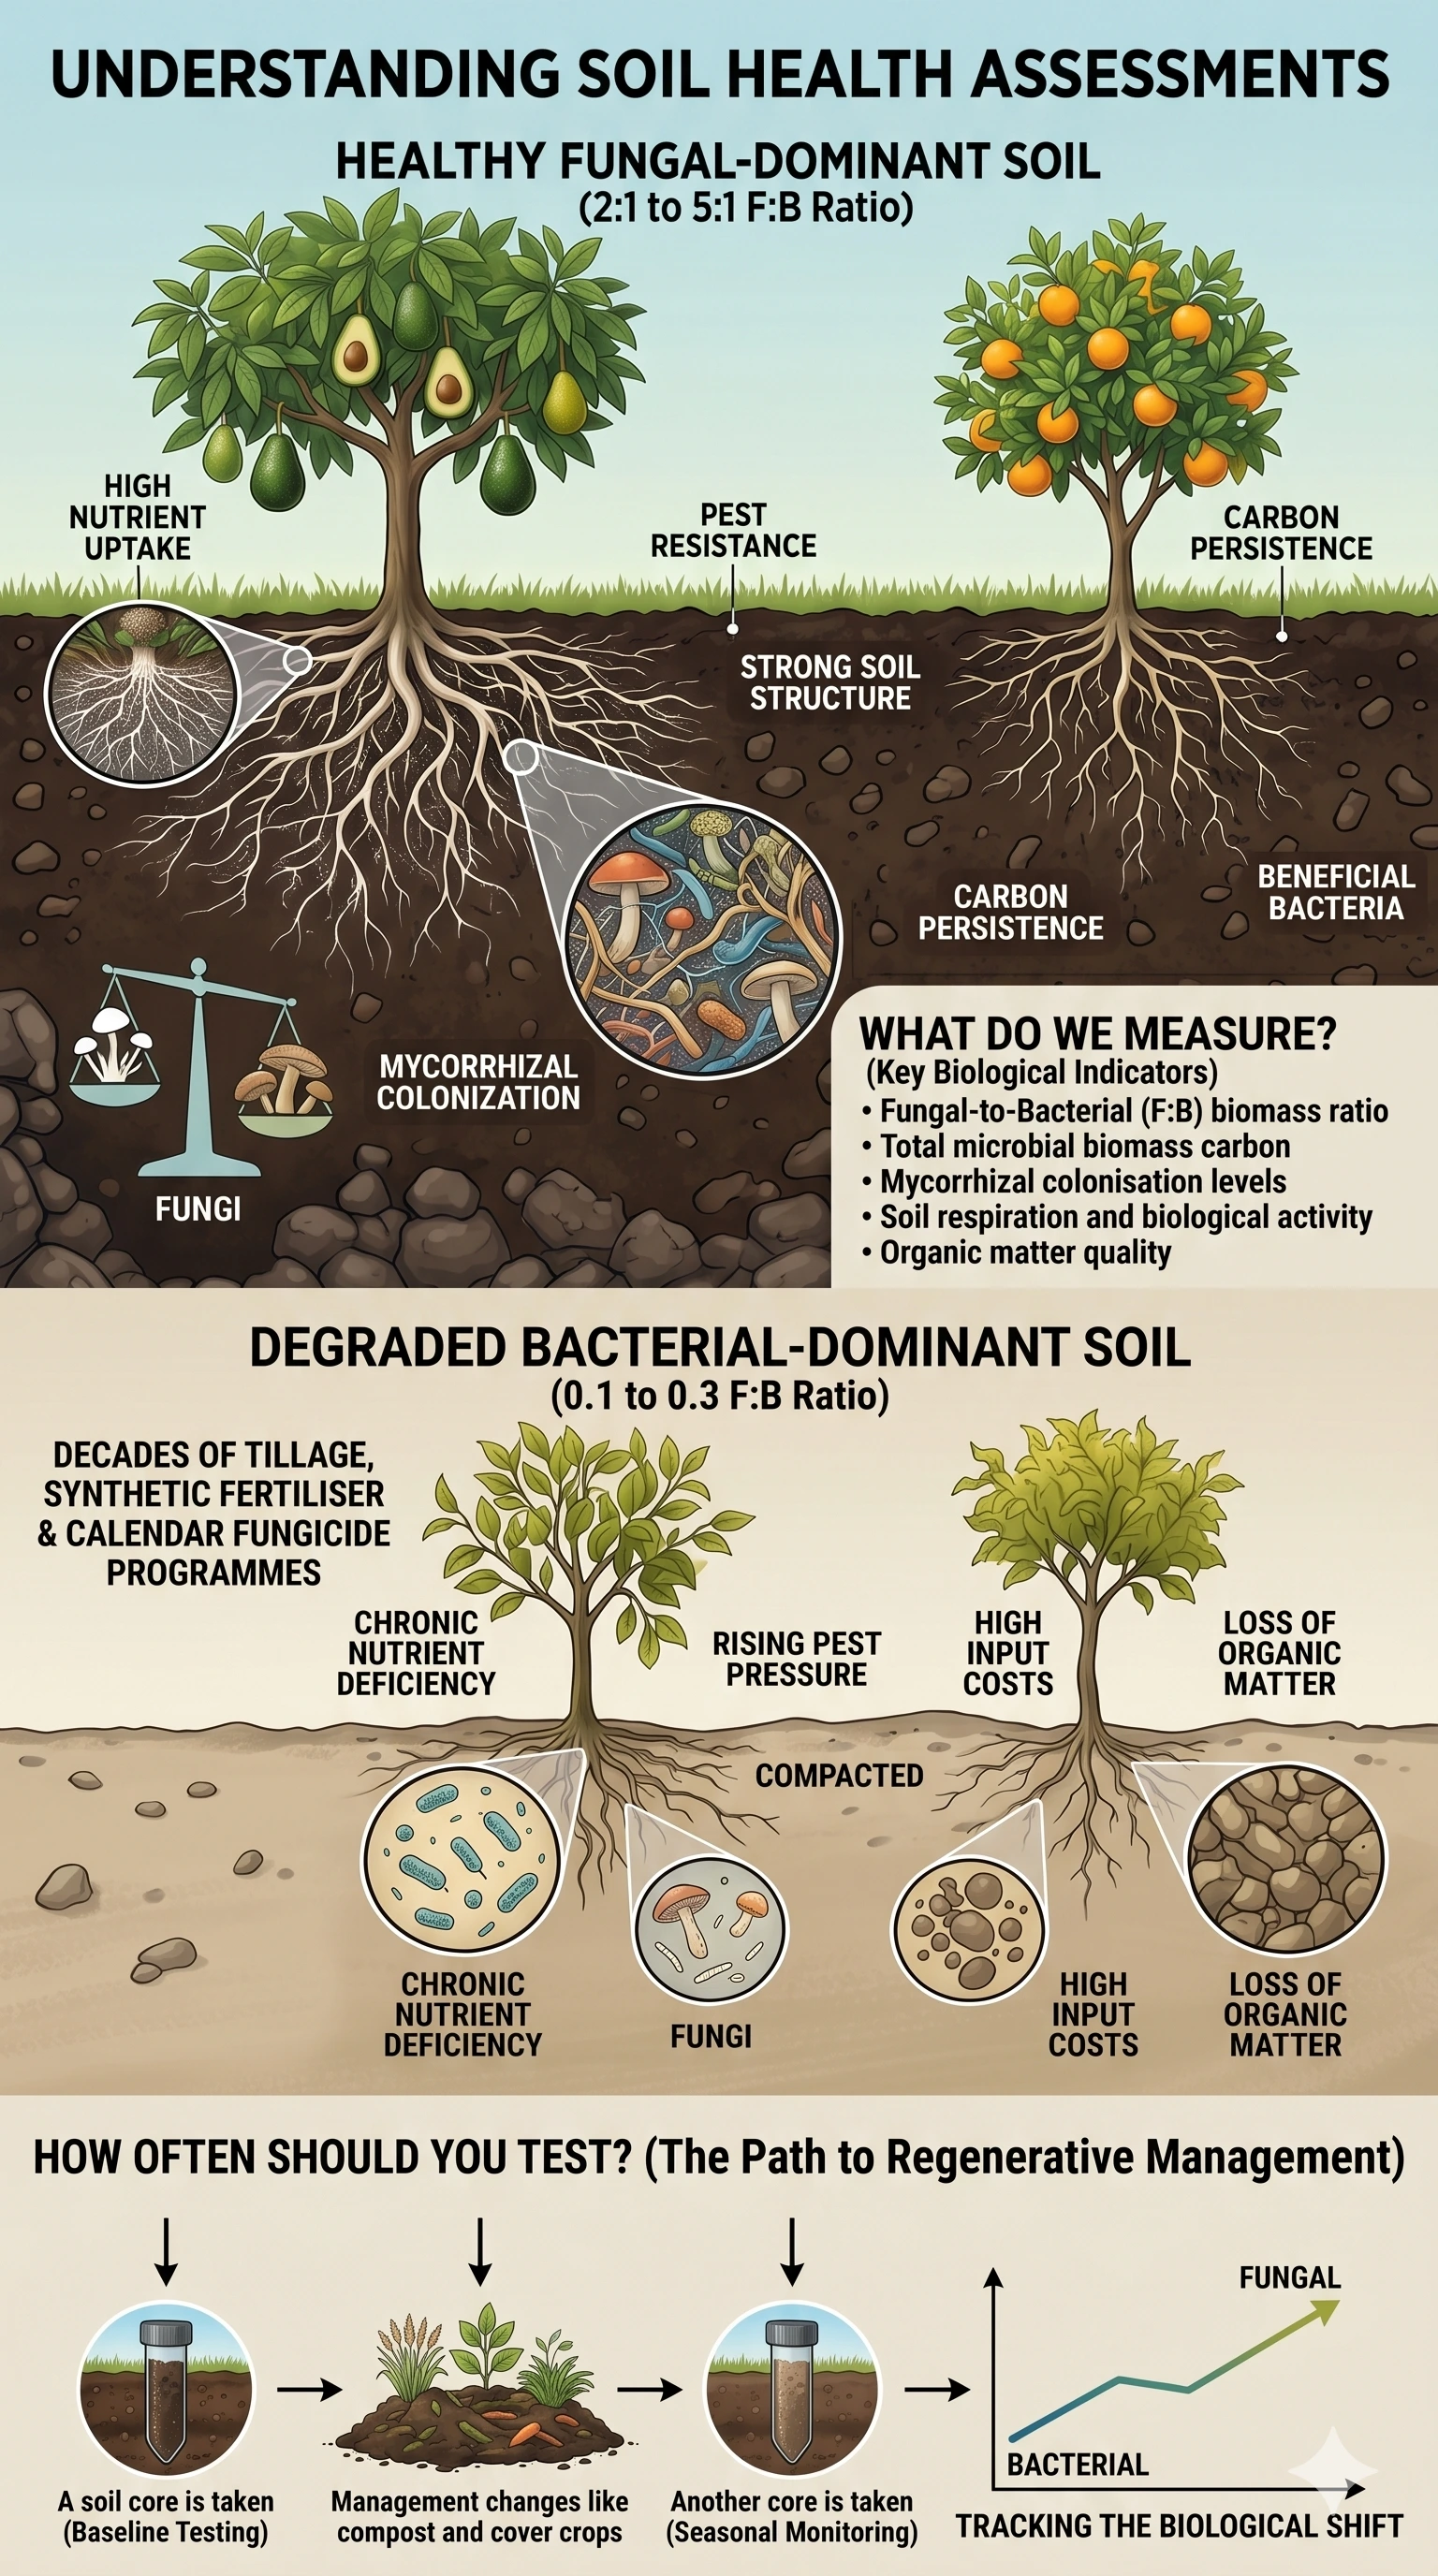
Your soil is a living ecosystem. Without understanding the biological community beneath your orchard—the fungi, bacteria and mycorrhizal networks that drive nutrient cycling—any restoration strategy is guesswork.
What do we measure?
We track the key biological indicators that reveal whether your orchard's soil ecosystem can support ecologically resilient fruit and nut production:
- Fungal-to-Bacterial (F:B) biomass ratio
- Total microbial biomass carbon
- Mycorrhizal colonisation levels
- Soil respiration and biological activity
- Organic matter quality and carbon persistence
Why does the F:B ratio matter?
Fruit and nut trees evolved in fungal-dominant ecosystems with F:B ratios of 2:1 to 5:1. Most South African commercial orchard soils sit at 0.1 to 0.3—a bacterial-dominated state caused by decades of tillage, synthetic fertiliser and calendar fungicide programmes. Restoring the fungal networks your trees depend on is the foundation of orchard ecology restoration.
Self-Service Soil Health Assessor
Our online Soil Health Assessor gives orchardists direct access to assess and monitor their soil biology. Sign up, input your data, and track your orchard's biological trajectory over time—putting the science of living soils into your hands.
How often should you test?
We recommend baseline testing followed by seasonal monitoring. This gives you a clear trajectory—you can see the living soil ecosystem responding to your management changes, not just hope it is working.
Pillar 2
SAP Analysis Interpretation
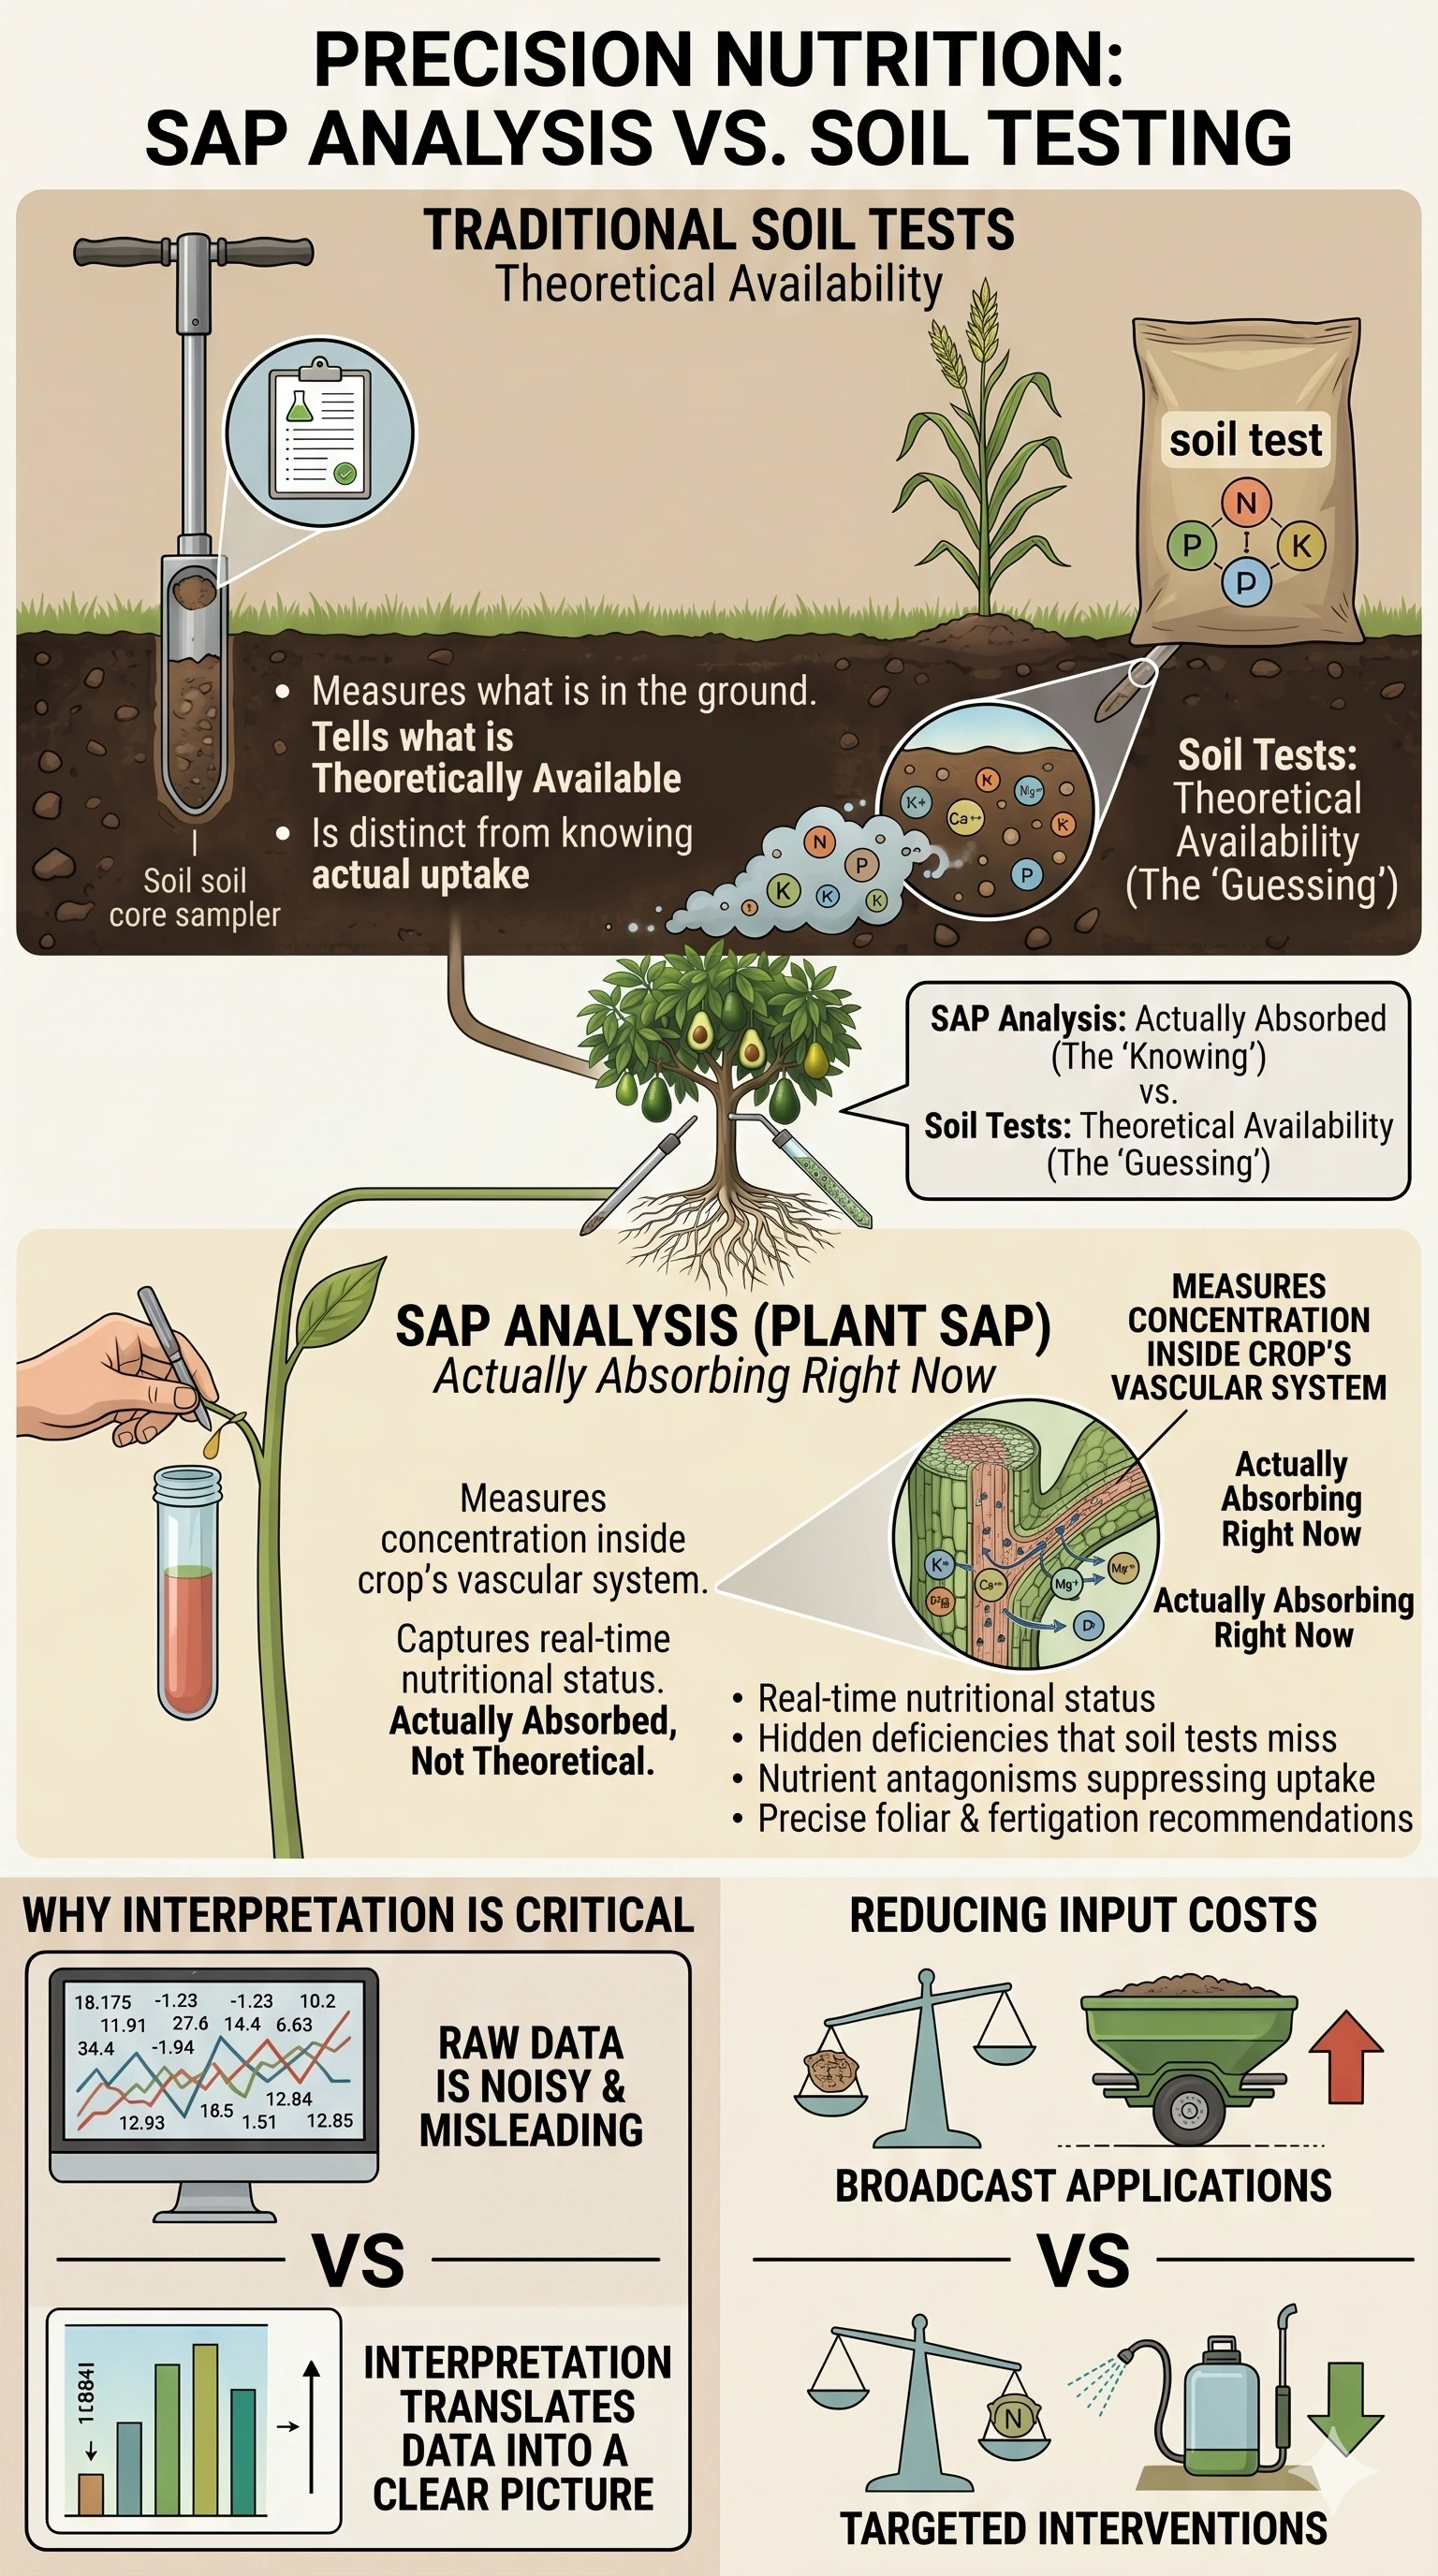
Traditional soil tests tell you what is in the ground. SAP analysis tells you what the plant is actually absorbing right now. That distinction is the difference between guessing and knowing.
What is SAP analysis?
SAP (plant sap) analysis measures the concentration of nutrients circulating inside your crop's vascular system at the moment of sampling. It captures real-time nutritional status—what the plant has taken up, not what is theoretically available in the soil.
Why is interpretation critical?
Raw SAP data from the laboratory is noisy and difficult to read. Nutrient interactions, antagonisms and synergies mean that individual numbers in isolation can be misleading. Our interpretation service translates those numbers into a clear nutritional picture:
- Which nutrients are being absorbed and which are locked out
- Hidden deficiencies that soil tests miss entirely
- Nutrient antagonisms that suppress uptake despite adequate soil levels
- Real-time crop stress signals before they become visible symptoms
- Precise foliar and fertigation correction recommendations
How does SAP analysis reduce input costs?
When you know exactly what the plant needs, you stop broadcasting blanket fertiliser applications. Targeted interventions based on SAP data typically reduce total fertiliser spend while simultaneously improving crop nutrition and resilience.
Pillar 3
Practical Management Actions
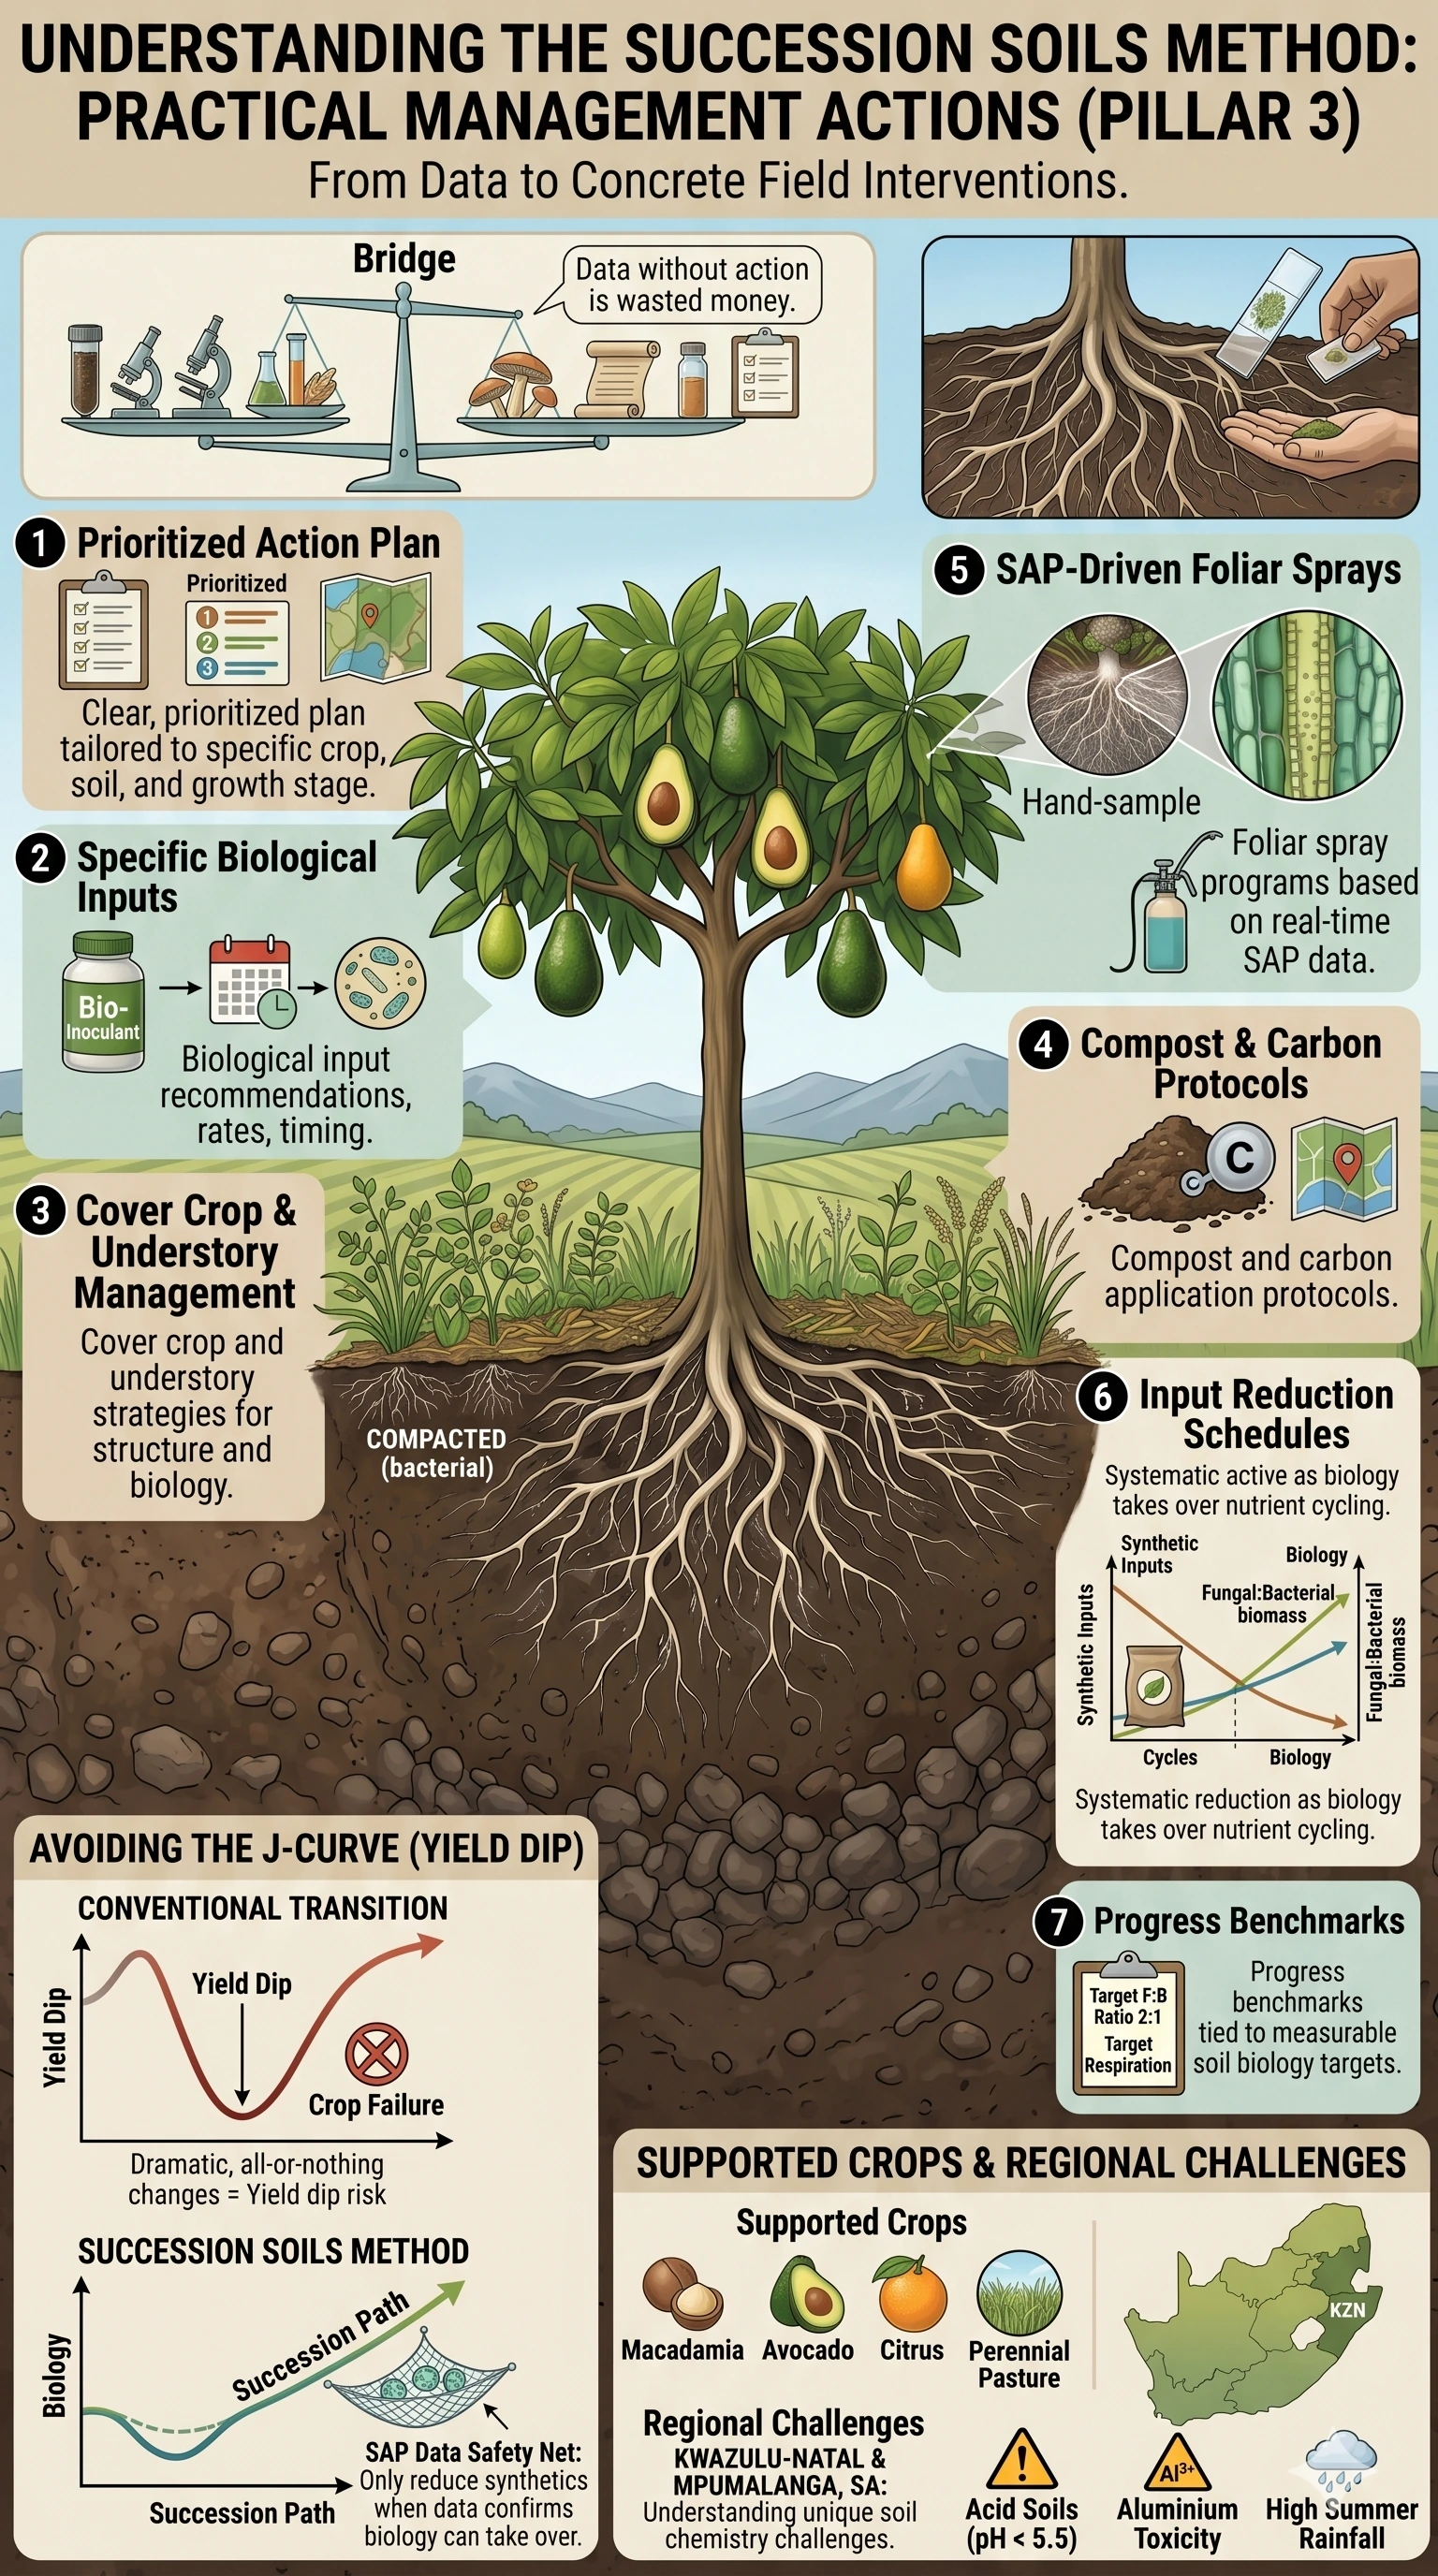
Data without action is wasted money. The third pillar of the Succession Soils Method turns your soil biology and SAP analysis results into concrete, implementable field interventions.
What do you receive?
Every assessment cycle delivers a clear, prioritised action plan tailored to your specific crop, soil type and growth stage:
- Specific biological input recommendations with rates and timing
- Cover crop and understory management strategies
- Compost and carbon application protocols
- Foliar spray programmes based on real-time SAP data
- Input reduction schedules as biology takes over nutrient cycling
- Progress benchmarks tied to measurable soil biology targets
How do we avoid the J-curve?
The key is sequencing. We do not ask you to make dramatic, all-or-nothing changes. Instead, we phase biological interventions alongside your existing programme, using SAP data as a safety net. As the biology builds, we systematically reduce synthetic inputs—only when the data confirms the soil can take over. This is how you avoid the yield dip that destroys most regenerative transitions.
Which orchards do we support?
Our management protocols are specifically designed for subtropical fruit and nut orchards—macadamias, avocados and citrus—in KwaZulu-Natal and Mpumalanga. We understand the unique soil ecology challenges of these regions, including acid soils, aluminium toxicity and high summer rainfall, and we partner with orchardists to restore the living soil ecosystems these trees evolved to depend on. See our crop-specific soil protocols for macadamia, avocado and citrus orchards.
Common Questions
Frequently Asked Questions
Pricing depends on the size of your operation and the number of sampling points required. Contact us for a tailored quote. Most commercial orchards start with 4–8 sampling points across representative blocks.
We collect leaf SAP samples at specific growth stages, send them to an accredited laboratory, then provide you with a detailed interpretation report. The report explains what your plants are absorbing, identifies hidden deficiencies and antagonisms, and gives you precise corrective input recommendations with rates and timing.
No. The Succession Soils Method is specifically designed to avoid abrupt changes. We phase biological interventions alongside your existing programme and only reduce synthetic inputs when SAP and soil data confirm that the biology can take over. This is how we avoid the yield J-curve.
The F:B ratio measures the relative biomass of fungi versus bacteria in your soil. Tree crops and woody perennials perform best in fungal-dominant soils (F:B of 2:1 to 5:1). Most commercial agricultural soils in South Africa are heavily bacterial-dominant (0.1 to 0.3), which limits the soil's ability to cycle nutrients, hold water and suppress disease.
Soil biology responds to management changes within a single season. Measurable shifts in the F:B ratio are typically visible within 12–24 months. Input cost reductions often begin in the first year as targeted SAP-based interventions replace blanket fertiliser applications.
Our primary focus is KwaZulu-Natal and Mpumalanga, where we have deep knowledge of local soil ecology and climate conditions. However, we can partner with orchardists in other subtropical regions of South Africa on a case-by-case basis. Contact us to discuss your situation.
By Crop
Crop-specific soil protocols
The method is the same, but each crop asks something different of the soil. See how we tune soil biology and SAP analysis to your trees:
Macadamia Soil Protocols Avocado Soil Protocols Citrus Soil Protocols
Where We Work
Regional soil consulting
We focus on the two provinces where South Africa's macadamia, avocado and citrus orchards concentrate. Each region has its own soil ecology — see how the method is tuned to yours:
Soil Consulting in KwaZulu-Natal Soil Consulting in Mpumalanga
Ready to Restore Your Orchard's Living Soil?
Book a free initial consultation and find out what is really happening in the ecosystem beneath your trees.
See the Full Workflow Book Your Consultation