
The Method
From Soil Sample to Spray Tank: How the Succession Soils Method Works
Three tools. One decision chain. Biology and physics before chemistry.
Most fertiliser decisions are made on a soil test alone. A soil test tells you what is sitting in the soil. It does not tell you what the tree is actually eating, and it does not tell you whether the tree can even use what it holds. That gap is where money gets wasted and yield gets lost.
The Succession Soils Method closes the gap with three tools used in order — from a free field score you can run yourself, to the engine that turns lab numbers into a spray tank. This page walks the whole chain on one real orchard block, so you can see exactly how it works before you start.
The Three Tools
You climb these in order
Each one answers the question the last one raised.
Soil Health Assessor — free, run it yourself
A field score of your living soil in about 30 to 45 minutes. Nine indicators you can see and measure with your hands and eyes — bare earth, infiltration, rhizosheath, aggregate stability, soil insect score, earthworms, nodulation, soil smell and rooting depth. No lab, no probe, no instrument. It gives you a quick overview of soil health and tells you one thing above all: whether a full sixteen-indicator assessment is called for. Run it three times a year — pre-flowering, mid-season, and post-harvest — so you are tracking a trend, not a snapshot. This is your starting point and it costs nothing.
Open accessFull Soil Health & Biodiversity Assessment — by request
The deeper version. It keeps the nine field indicators and adds seven that a field walk cannot produce — compaction, measured with a penetrometer as the depth at which the soil reaches 300 psi, and the biology a field score can only estimate: the fungal-to-bacterial ratio, microbial biomass, and a basal CO₂ test that reads how hard the soil life is actually breathing. Sixteen indicators in total, across four tiers, with gateway logic that catches the problems which override everything else.
ProvisionedSAP Analysis Engine — by request
The engine that reads your sap, soil, leaf and soil-health reports, then cross-references the data to identify physical, biological and chemical bottlenecks that are limiting the full genetic potential of your trees. Then, based on the findings, the engine produces a comprehensive report detailing the findings and recommending programmes tuned to each block, crop and growth stage. It provides detailed rates and mixing instructions that remove the risk of precipitation when they are followed — a risk that arises when multiple products are mixed in one tank.
ProvisionedThe first tool is open to everyone. The other two are switched on for growers and consultants who are ready to act on what they find — a short request tells us your crop, block size, and region, and we set you up.
The Principle Behind All Of It
Biology and physics override chemistry.
Here is the rule the whole Method runs on. A tree cannot use a nutrient the soil will not release, and it cannot build with a nutrient it cannot move to where it is needed. If the soil is compacted, bare, or biologically dead, good chemistry stays locked away no matter how it looks on paper.
So before the engine writes a single line of treatment it runs the gateway checks — the physical and biological limits on whether this soil can take a product at all. Where one fails, the correction is not cancelled; it is routed through the leaf while you rebuild the ground underneath. And where a soil-applied input is actively making things worse, the engine names it and stops it. You do not throw good product at ground that cannot use it.
Watch this rule decide the whole programme on Block 12B.
The Worked Example
Block 12B, step by step
A commercial macadamia block on the KwaZulu-Natal North Coast. Sandy loam. Sap, soil and leaf tissue all sampled on the same day, with a sixteen-indicator field assessment walked alongside them. On the soil test this block looks workable — its calcium-to-magnesium ratio bands as optimum for macadamias, and its sodium is nowhere near the danger mark. It still cannot take a soil application at all. Here is what the three tools found, step by step.
Score the soil
Free field scoreMeasure biology
16-indicator assessmentTest the sap
Sap, soil & leaf + conditionsDiagnose
SAP engine ranks itStop & route
Stop list, then the tanksRebuild
Fix the soil, resampleScore the living soil, free
Tool: Soil Health Assessor (free, 9 indicators)
What you do
Walk the block and score nine field indicators — bare earth, infiltration, rhizosheath, aggregate stability, soil insect score, earthworms, nodulation, soil smell and rooting depth. Every one of them is something you can see, smell, dig or time with no equipment beyond a spade and a bottle of water. The tool adds them up out of 100 and flags anything critical. It takes 30 to 45 minutes, and you run it three times a year: pre-flowering, mid-season, and post-harvest.
Why it matters
This is triage, and that is the whole point of it. The free score is not trying to name the cause of anything — it is answering one question: does this block need a proper look? Bare earth, aggregates that fall apart in water, an absent earthworm, a sour smell — these are visible without a laboratory, and together they tell you whether the ground is delivering or whether something is wrong underneath it. It costs nothing, so there is no reason not to know.
What it cannot do is tell you what is wrong. Compaction, the measured biology and the chemistry that drives them are not in these nine — they need a probe and a laboratory, and that is the next tool. A poor free score is a reason to go and measure, not a diagnosis.
What 12B showed
The free score flagged it immediately, and every signal came from something visible on the walk. Half the block read as bare soil. Aggregates collapsed in water on the slake test — 1 out of 5. Earthworm activity was low and insect diversity scored 1 out of 10.
None of that names a cause. What it does is settle the next decision: this block needs the full assessment, not a fertiliser order.
(Record temperature, humidity and soil moisture while you score. They matter for everything that comes next, and they cost you nothing to write down at the time — which is the only moment they can be captured honestly.)
Measure the biology
Tool: Full Soil Health & Biodiversity Assessment (gated, 16 indicators)
What you do
Run the full assessment. It keeps the nine field indicators and adds seven more — the ones that need an instrument or a laboratory. Compaction comes in here, measured with a penetrometer as the depth at which the soil reaches 300 psi, and so does the biology a field score can only estimate: the fungal-to-bacterial ratio, microbial biomass, and a basal CO₂ test that reads active microbial respiration. Sixteen indicators in total, scored across four tiers out of 100.
This is also where the gateway logic lives. Some readings do not simply lower a score — they override it, because they decide whether the soil can take a product at all.
Why it matters
The free score tells you whether the soil is struggling. The full assessment tells you why, by measuring the living part of the soil instead of estimating it. That measured biology is what decides whether the ground can deliver and cycle nutrients on its own, or needs rebuilding first.
What 12B showed
21 out of 100 — critical, gateway failed. And the thing that failed it was the one indicator the free walk could not have found.
The penetrometer met 300 psi at 165 mm, where the floor is 300 mm. That is a gateway failure: it does not just lower the score, it caps it, because a pan that shallow decides what can be done with the block regardless of anything else on the sheet. The free score had said something is wrong here. This is the reading that says what.
The measured biology closed it out. The fungal-to-bacterial ratio came back at 0.30:1, where a perennial orchard wants a fungal-dominant soil — confirming from the laboratory what the missing earthworms and the collapsed aggregates had already hinted at in the field.
Physically, the root system is capped. Biologically, the soil has largely stopped doing its half of the work. That verdict is what routes the entire programme through the leaf three steps from now — you cannot feed a tree through the roots of a soil in this state.
Test what the tree is eating
Tool: sap analysis (plus soil and leaf for triangulation)
What you do
Send new-growth and old-growth leaf samples for sap analysis. Add a standard soil test and a leaf tissue test so the engine can cross-check all three. Sample at the critical stages in the tree's year — early flower, fruit or nut set, fill, maturity, and post-harvest — because what the tree needs changes as it moves through the season. And record the temperature, humidity, and soil moisture at the moment of sampling — this is not optional, and the next paragraphs explain why.

Why three tests and not one
With sap, soil and leaf all in hand the engine can do something no single test can: separate a shortage from a lock-up. A low sap reading has two opposite causes — a soil that genuinely does not hold the nutrient, and a soil that holds plenty but cannot release it. The first calls for more product. The second calls for none, and for fixing whatever is blocking release. Guess wrong and you spend money making the problem worse. On 12B all three tests were supplied, so every finding below carries full evidence behind it rather than a single reading's worth.
You can watch it happen on this block. The sap potassium came back high — on its own, that is the classic signature of potassium crowding the other cations off the root, and it is exactly the kind of reading that gets a potassium programme cancelled. The soil test does not support it. So the engine says so in those words and declines to call it crowding. One test proposed a conclusion; a second refused it; and no recommendation moved. That is the whole argument for triangulation in a single line of a report.
Why the weather matters — the mobility check
Some nutrients move around inside the tree; some do not. Calcium and boron travel almost entirely in the transpiration stream — the flow of water the tree pulls up from root to leaf. They only reach the new growth when the tree is transpiring. That flow is driven by vapour-pressure deficit (a product of temperature and humidity) and by how much water is in the soil.
So a reading has to be judged against the conditions it was taken in. If the block was sampled under conditions that support transpiration — a working vapour-pressure deficit and adequate soil moisture — the reading reflects true nutrient status. If the conditions were against it — dry soil, or air too still to move water — that does not cancel the reading; it becomes part of the diagnosis, and it points at the water and the soil as much as the chemistry. That is why we log the weather and the soil moisture at both the assessment and the sap sampling: it is what turns a reading into a diagnosis.
What 12B showed
This is where a soil test would have sent you the wrong way — not because the numbers came back bad, but because they came back good.
The soil's calcium-to-magnesium ratio read 2.78. Against macadamia's crop range of 2.5–5.4 that bands as optimum: on the question of whether this soil is feeding the tree, the answer is yes. Exchangeable sodium read 2.2% of the exchange, comfortably under the 5% mark where a soil begins to disperse. Nothing to flag.
Then the same 2.78 fails a different test. There is a second threshold on Ca:Mg that has nothing to do with feeding the tree — a structural floor at 4.0, below which the exchange is magnesium-dominant enough that aggregates break down when they get wet and re-settle dense. The crop range asks whether the soil is feeding the tree. The structural floor asks whether it holds its shape. A block can pass one and fail the other, and this one does. Neither reading is wrong, and they are not in conflict; they are answering different questions, and only one of them is on a standard soil report.
Read together with the sap and the field assessment, three things fall out:
- A root system capped at 165 mm. Roots meet 300 psi at 165 mm, and resistance does not fall back below it until 360 mm — a restrictive layer 195 mm thick. Root elongation halves at about 1 MPa and effectively stops between 2 and 2.5 MPa, so below that depth this tree is not building new root. The soil volume it can actually mine is a fraction of what the block area suggests.
- Biology that has stopped delivering. Iron, copper, boron, calcium and zinc all reach the root through soil life. With the fungal-to-bacterial ratio at 0.3 and earthworms scarce, that partnership has broken down — and those are precisely the nutrients the sap is short of.
- A soil that is compacting itself. The magnesium-dominant exchange is what built the pan. This is not a tractor problem; it is a chemistry problem wearing a tractor's clothes — which changes the fix completely, as Step 6 shows.
What a soil test sees
What the sap + engine see
Conditions at sampling — what they settled, and what they cost us
The block was sampled at 24.0 °C and 67% humidity, on soil of moderate moisture. That pairing gives a vapour-pressure deficit of 0.98 kPa — a working pull, with enough water in the ground to answer it. This is the mobility check closing, and it matters because of what it rules out: the transpiration stream was moving. So the low calcium and boron in the new growth are not an artefact of a tree that had shut its stomata on the day. The shortage is real, and the reason it is not being answered through the ground lies below, not in the weather.
The same reading costs us something elsewhere. The soil was at 70% of field capacity. That is drier than the 85–110% window in which a cone penetrometer reading can be interpreted at all (ASABE EP542; Busscher 1990). Dry soil reads harder, so 300 psi was met shallower than it would have been at field capacity, and the pan is very likely overstated.
The engine says so, in the report, and then declines to act on it: it grades the compaction finding low confidence and refuses to issue a ripping depth until the reading is repeated near field capacity. The gateway still stands and the block is still routed to the leaf — that call does not depend on the exact depth. But nobody gets sent out with a tine on the strength of a measurement taken in the wrong conditions.
Run the SAP Analysis Engine
Tool: SAP Analysis Engine (by request)

What you do
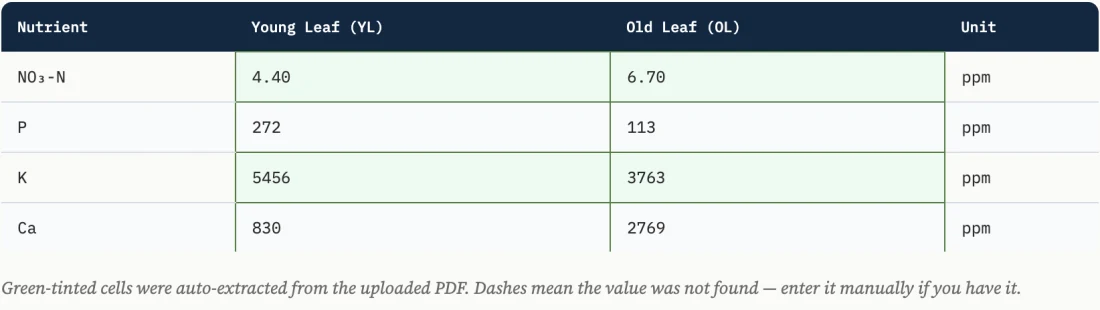
Upload the sap results, add the soil and leaf tests, and set your crop, growth stage, tank size, spray area, and the field conditions at sampling. The engine reads all three lab tests against the field assessment, then grades every finding by how much evidence actually carries it.
Why it matters
Triangulation stops you acting on a single reading — a finding confirmed across two or more of sap, soil and leaf is worth more than one resting on sap alone, and each is marked accordingly. The engine also takes the temperature, humidity and soil moisture you recorded and weighs whether a low reading is a true shortage or a mobility problem. And this is where the override rule bites: before it writes a line of treatment, the engine runs the gateway checks — the physical and biological limits on whether the soil can receive a product at all.
What 12B showed
One gateway, and it fails.
| Indicator | Reading | Limit | What it means |
|---|---|---|---|
| Compaction | 165 mm to 300 psi | < 300 mm | Below 165 mm the tree is not growing new root. Until the pan is relieved, soil-applied product is being placed in ground the root system cannot reach — it is spent without effect. |
That single line decides the whole programme. One of one block cannot take a soil application, so every nutrient correction is routed to the leaf, which does not depend on root uptake. Three further findings came with it, each carrying its own confidence grade:
- Roots are restricted by compaction, and the biology has collapsed with it. Confidence: high The soil holds enough iron, copper, boron, calcium and zinc. The pan sits above the depth the roots need, so they stop where the resistance starts — and the soil life that would work that pan open over time is not there to do it. Two findings, one block, and the programme has to answer both.
- The compaction is chemical, not mechanical. Grade B Ca:Mg at 2.78 sits below the 4.0 structural floor while exchangeable sodium is only 2.2% — so magnesium, not sodium and not the tractor alone, is what is dispersing this clay.
- No ripping depth is given. Grade C The reading was taken at 70% of field capacity, outside the window where it can be interpreted. The engine withholds the number rather than publish one it cannot stand behind.
| Depth to 300 psi | 165 mm |
| Base of the pan | 360 mm |
| Pan thickness | 195 mm |
| Texture | Sandy loam |
| Soil moisture at the reading | 70% of field capacity |
Compaction is measured as the depth at which a penetrometer reaches 300 psi (2.07 MPa) — not a house threshold, but the point at which root elongation has already halved and is heading for a stop (Taylor & Gardner 1963; Bengough & Mullins 1990; Bengough et al. 2011). Six insertions are taken and the median reported.
Read the report: what stops, and where the rest goes
Tool: SAP Analysis Engine report
What you do
Read the engine's output — the graded findings, the Stop List (what to stop applying now), and the routing decision that says where each correction can actually be delivered.
Why it matters
Two different things save you money here, and they are worth keeping apart.
The Stop List names soil-applied inputs that are actively making a problem worse — potassium crowding other cations off the root, or ammonium forms feeding an acidification the tree cannot recover from. When the engine finds an antagonism like that it says so, and it names the forms to stop. Foliar corrections for the blocked nutrients still go ahead; it is the soil-applied form that comes off.
Routing is the other one, and it fires even when nothing needs to stop. A gateway failure is a physical or biological limit that invalidates a chemical intervention: product applied to a soil in physical failure never reaches the root, so it is spent without effect. The correction is not cancelled — it is sent somewhere it works.
What 12B showed
Zero hard stops. Nothing on this block is antagonising anything else. There is no potassium excess and no ammonium backlog, so there is nothing to take off the programme.
And it makes no difference at all to where the product goes. The compaction gateway had already failed, so all six corrections — iron, copper, zinc, boron, molybdenum and calcium — were routed to the leaf regardless.
Mix and spray
Tool: SAP Analysis Engine — Field Sheet
What you do
Follow the programme as the engine builds it: as tanks, in a set mixing order, with the water rate and pass count worked out so every nutrient lands at the rate the tree needs without the mix burning the leaf.
Why it matters
Getting the right nutrients is only half the job — getting them onto the leaf without doing harm is the other half. Two things wreck a foliar spray. The first is incompatibility: some products cannot share a tank. Calcium and phosphate lock up into a solid that never reaches the tree, and several trace metals clash the same way. That is why the engine partitions the programme into separate tanks by what the products are made of, not by which nutrient asked for them.
The second is load on the leaf, and there are two separate ceilings on it. One is the total salt load of the tank, measured as electrical conductivity: every dissolved salt adds to it, and past a safe concentration the spray pulls water back out of the leaf and scorches it. The other is per-nutrient, because some elements have a burn threshold of their own well below the tank's. The engine totals both and holds both, and it will split a job into more passes rather than risk the crop.
On top of that, it does not simply dump raw salts on the leaf. Every tank carries them in with absorption aids — fulvic acid to chelate the metal salts and carry them across the cuticle, seaweed extract for cytokinins and stress tolerance, fish hydrolysate as an amino-acid chelator and microbial feed that shields the metals so they stay plant-available, and sorbitol or mannitol as a humectant, which lowers the deliquescence point of the spray so the salts stay dissolved on the leaf surface and keep crossing the cuticle instead of drying into crystals.

What 12B showed
Two tanks, both well inside the salt ceiling.
| Mix | Carries | Tank EC | Ceiling |
|---|---|---|---|
| Mix 1 — micro | Ferrous, copper and zinc sulphate, plus sodium molybdate | 0.31 mS/cm | 3.0 mS/cm |
| Mix 2 — calcium & boron | Solubor and calcium nitrate | 0.50 mS/cm | 3.0 mS/cm |
No pass-splitting was needed on salt load. The limit that actually bound on this block was the other one:
The mixing order is a safety instruction, not a convenience
Raw metallic sulphates react with the phosphates in fish hydrolysate and form insoluble precipitates that destroy the formulation and block the sprayer. The fulvic acid has to be given time to chelate the metals before the fish goes in. So: fulvic into the tank water first and agitate; each sulphate dissolved in its own bucket, iron first, and added slowly with the agitator running; a full ten minutes of agitation to let chelation finish; then the molybdate, dissolved separately, because it is an anion and chelation does nothing for it; then seaweed, then fish, then the sorbitol. The Solubor is pre-dissolved in warm water and goes in last, on its own — it dissolves slowly, and its alkalinity would undo the fulvic's acidification and drop the metals straight back out.
One more, specific to this programme: Mix 1 carries ferrous sulphate, not a chelate. Sulphate iron precipitates above about pH 6.5, so the fulvic must already be in the tank water before the iron goes in — check the tank sits at pH 5.5–6.0 at that point, and spray the same day.
Registered label rates take precedence over every rate the engine prints. Check each product label before mixing; where the label and the programme disagree, follow the label — then refer it back, because a rate that had to be overridden is worth knowing about.
Rebuild the soil, then resample
Tool: the Method (and back to the Assessor)
What you do
While the foliar carries the tree, fix what the assessment flagged — and fix it in the right order. On 12B that means the calcium correction first, the ripper second, and the biology alongside both. Then resample the sap at the next critical stage and re-score the soil at its next window, under recorded conditions, so the comparison is fair.
The order matters more than the products
The pan on this block is chemical: a magnesium-dominant exchange that slumps every time it gets properly wet. Loosening a dispersive soil before the calcium is on it produces a profile that looks excellent behind the tine and settles back to the same density after the first heavy rain. So the calcium goes first, and it is sized against the exchange rather than against a calcium reading — because magnesium is what is dispersing the clay, and it takes a specific amount of calcium to displace it.
| Order | Input | Rate | Why |
|---|---|---|---|
| 1 · Exchange | Mined gypsum — CaSO₄·2H₂O (Ca 23%, S 18%) | 800 kg/ha | 0.37 cmol(+)/kg of calcium has to displace 0.37 cmol(+)/kg of magnesium to bring Ca:Mg to 4.0. Over 15 cm of topsoil at bulk density 1.3 that is 800 kg/ha of material, after a ×1.25 factor for incomplete exchange and for mined gypsum being under 100% pure. |
| 2 · Physical | Ripping | depth withheld | Not until the compaction reading is repeated near field capacity, and not until the calcium is on the exchange. |
| 3 · Biology | LIMO (on-farm microbial brew), fish silage, cane-sugar molasses | 20–40, 20–40 and 5–20 L/ha | Restores locally-adapted microbial diversity, feeds it with dense amino acids and protein, and supplies the soluble carbon that drives the bloom. This is the half of the diagnosis a spray tank cannot deliver. |
The biological rates are standard agronomic label ranges, not doses derived from this block's lab data. Treat them as starting points to calibrate against a soil test, soil moisture and local practice.
Why it matters
Foliar feeding is the bridge, not the destination. The goal is soil that holds a pore open through a wet spell, lets a root through past 165 mm, and delivers its own iron and zinc without a spray tank. And the finish line here is a reading, not a date: resample the exchange after the season and keep correcting until the dispersive cation sits inside band. That number is what says the job is done — not a fixed schedule, and not a hopeful look at the trees.
Where 12B stands
Gateway identified, cause separated from symptom, all six corrections routed to the leaf, calcium sized against the exchange, and the ripper deliberately held back until the pan can be measured honestly. This block is early in its transition. We will add the resample and the yield results here as they come in.
Why This Beats A Soil Test Alone
Guessing versus knowing
Run 12B on a soil test by itself and every number would have come back inside its band. Calcium-to-magnesium optimum for the crop. Sodium nowhere near the dispersion mark. You would have reached for the usual bag, put it on the ground, and lost it — because the problem was never a nutrient that was missing. It was a root system that stops at 165 mm, a soil biology that no longer delivers the five nutrients it is supposed to deliver, and a magnesium-dominant exchange quietly rebuilding the pan every time it rains. None of the three is a line on a soil report.
The Method caught all of it because it looked at four things at once: the soil (what is there), the sap (what the tree is actually eating and using), the living soil score (whether the ground can deliver it), and the conditions at sampling (whether the reading can be trusted at all). That last one is why this report refuses to name a ripping depth. Knowing what you cannot yet conclude is part of the difference between guessing and knowing.
Your Next Step
Start where it costs nothing
Want the detail? Read the SAP Analysis Engine User Manual — every field, every score, explained in plain language.
Growing a specific crop? See how the Method is tuned to macadamia, avocado and citrus soils.
Common Questions
What is SAP analysis and how is it different from a soil test?
A soil test tells you what is in the soil. Plant SAP analysis tells you what the tree has actually taken up and is moving in its leaves right now. We test the sap from old and new leaves, so we can see a problem forming weeks before it shows on the tree or in the fruit. That is why we test the plant, not just the soil.
How long does a regenerative transition take?
Most orchards begin showing measurable improvements within one to two growing seasons, while a resilient, biologically active soil typically develops over three to five years. When the transition is carefully managed, the yield dip often associated with the “J-curve” can usually be minimised or avoided as trees become less dependent on synthetic inputs and soil biology takes over key nutrient cycling functions. Depending on the starting condition of the soil, climate, and management, measurable improvements in soil biological activity are often seen within as little as eight months.
Will my yield drop while I move to regenerative practice?
The honest answer is that yield can dip during the changeover if it is rushed. Our whole method is built to avoid that. We cut inputs in step with the soil's own supply, guided by SAP testing, so the tree is never left short. The goal is steady yield on falling costs, not a gamble.
Which crops do you work with?
We work with macadamia, avocado and citrus growers. Most of our work is in KwaZulu-Natal and Mpumalanga, though the method suits any commercial fruit or nut orchard.
What is the F:B ratio and why does it matter for my orchard?
F:B is the balance of fungi to bacteria in your soil. Young, disturbed soils are bacteria-heavy; healthy orchard soils are fungal dominant. Tree crops like macadamia, avocado and citrus feed best in fungal-dominant soil, where mycorrhizal fungi extend the root system and help the tree draw water and nutrients. Building that fungal side is a big part of what we do.
How do I get started with Succession Soils?
The first step is a soil health assessment, so we can see what your soil is doing before we change anything. From there we build a simple plan and track it with SAP testing through the season. Get in touch to book a first consultation.